

(PJM Interconnection Process Subcommittee — August 24, 2026)
PJM’s interconnection queue now holds 715 generation requests totaling 201 GW — roughly the installed capacity of the entire Western Interconnection. The queue is dominated by natural gas (99.8 GW across 147 projects) and standalone storage (60 GW across 314 projects), with solar, nuclear, and wind filling the rest. Processing that volume through a three-phase study cycle that stretches into 2028 makes every policy and process decision consequential. Three items from this month’s Interconnection Process Subcommittee meeting illustrate where those decisions are headed.
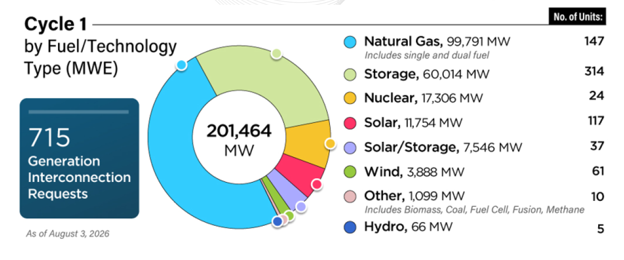
Figure 1: Cycle 01 Statistics pie chart showing 201,464 MW by fuel type
Source: PJM, “Cycle Schedule Update,” PJM IPS Meeting, August 24, 2026
1. The ERIS Question: Why PJM Has the Lowest Energy-Only Interconnection Rate in the Country
FERC Order 2003 created two levels of interconnection service. Energy Resource Interconnection Service (ERIS) provides “as available” injection rights — a generator can sell into the energy market but cannot participate in the capacity market or earn Capacity Interconnection Rights. Network Resource Interconnection Service (NRIS) provides full deliverability, capacity market eligibility, and a more comprehensive study scope including the Generator Deliverability Test. In PJM’s terminology, NRIS projects are called Capacity Resources and ERIS projects are called Energy Resources.
The trade-off is simple in theory: ERIS should be faster and cheaper because it requires fewer network upgrades, while NRIS provides full market access. In practice, PJM has the lowest ERIS adoption of any ISO in the country. According to Lawrence Berkeley National Laboratory data, 99% of MW active in PJM’s queue hold NRIS, compared to 89% in ISO-NE, 82% in CAISO, and 66% in SPP. ERCOT, which has no capacity market, is 100% energy-only by design.
An analysis presented at the meeting examined why this gap exists and whether it needs to close. The research, conducted by Aurora Energy Research, modeled ERIS project economics in four PJM zones — PPL, AEP, ComEd, and Dominion — under four scenarios ranging from low build-out to full adoption of PJM’s latest load forecast. The findings: solar and onshore wind projects requesting ERIS clear a 9% internal rate of return hurdle in nearly every zone and scenario. Solar IRRs ranged from 6.7% in the low/PPL case to 14.4% in the high-load/Dominion case. Wind IRRs were higher across the board, reaching 18.1% in the high-load/Dominion scenario.
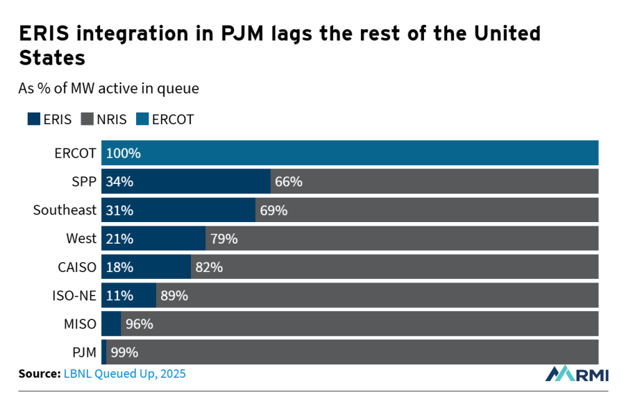
Figure 2: ERIS integration comparison across ISOs bar chart
The system-level case was equally direct: adding 10 GW of ERIS solar and wind by 2028 could reduce PJM ratepayer costs by $10.9 billion over a decade. During Winter Storm Elliott, PJM’s wind fleet maintained 83% availability compared to 66% for gas — a reminder that energy-only resources contribute to reliability even without capacity obligations. The analysis noted that realizing these benefits may require changes to resource adequacy modeling and capacity market constructs to properly credit ERIS resources.
Three barriers explain the current gap. First, PJM’s implementation of ERIS study rules has been conservative — Energy Resources still go through the same cycle process as Capacity Resources and can still trigger network upgrade cost allocations, though the scope of the powerflow study is less stringent (Individual Plant Deliverability test only, versus the Generator Deliverability Test plus IPD for Capacity Resources). Second, the financial upside for developers choosing ERIS over NRIS has been uncertain, because forgoing capacity market access means forgoing RPM revenue. Third, the industry has had a long-standing preference for NRIS given its assumed higher reliability value.
The recommendations presented called for studying ERIS in a separate and parallel track with shorter, clearly defined timelines; minimizing the scope of required network upgrades; and addressing congestion-related curtailment through the transmission planning process rather than the interconnection process.
What should be watched: PJM’s new GD2 (Generator Deliverability 2) test under the Transition Cycle 2 process is intended to streamline the deliverability assessment. Whether GD2 produces meaningfully different cost and timing outcomes for ERIS versus NRIS projects will determine whether further study reforms are needed. If the cost difference between the two paths remains small, few developers will choose ERIS regardless of the financial modeling.
2. Cycle 01 and Transition Cycle 2: Where the Queue Stands
PJM’s first cycle under the reformed interconnection process (Cycle 01) received 715 generation interconnection requests totaling 201,464 MW. The fuel mix tells a story about where the market is heading: natural gas leads with 99,791 MW (147 projects), followed by standalone storage at 60,014 MW (314 projects), nuclear at 17,306 MW (24 projects), solar at 11,754 MW (117 projects), solar-plus-storage at 7,546 MW (37 projects), and wind at 3,888 MW (61 projects). The remaining 1,165 MW across 15 projects includes biomass, coal, fuel cell, fusion, methane, and hydro.
Application reviews were posted on August 3. PJM expects to post the Phase I summer peak base case on August 28, with Phase I study work starting September 28. Winter peak and light load base cases are expected on September 11. The Cycle 01 timeline runs through May 2028, with Phase I starting in September 2026, Decision Point I in January 2027, Phase II through August 2027, and Final Agreement Negotiation wrapping in May 2028. Each phase depends on Transition Cycle 2 milestones — Cycle 01 Phase I cannot begin until TC2 Decision Point 2 closes and Cycle 01 models have been posted for 30 days.
Transition Cycle 2 is now in Phase III, with PJM actively reviewing Decision Point 2 submittals. The remaining Phase III activities include updating models to remove withdrawn projects, retooling load flow and stability results for DP2 changes, running PSCAD/EMT studies for projects in weak grid areas, and coordinating Affected System Studies.
The Expedited Interconnection Track (EIT) has received 3 applications, with data reviews in progress. Approved applications will be posted under the Non-Cycle Study Request page.
Key dates: August 28 — Phase I summer peak base case posting. August 31 — Winter CIR application window opens for the 2030/31 delivery year. September 11 — Winter peak and light load base cases. September 28 — Cycle 01 Phase I begins. October 31 — Winter CIR window closes.
3. Surplus Interconnection Requests Move to NextGen
Starting August 27, all new Surplus Interconnection Requests must be submitted through PJM’s NextGen platform. The legacy Queue Point system will no longer accept new surplus requests after that date. Requests already submitted in Queue Point will be processed to completion there, but any request that was created in Queue Point but not yet submitted (in-progress status) must be re-created and submitted in NextGen. In-progress requests will remain visible in Queue Point for reference.
The NextGen platform mirrors the same data fields as Queue Point, with two operational improvements: study deposits are now calculated automatically based on the tariff formula ($10,000 plus $100 per MW, capped at $110,000), and the Surplus Interconnection Service Study Agreement (SISSA) is generated automatically with electronic signature capability.
For developers with pending surplus requests: if your request is in-progress in Queue Point, re-create it in NextGen before or shortly after August 27. The old system will display a redirect message, but any unsaved work in Queue Point’s in-progress queue will not transfer automatically.
What Market Participants Should Track
Developers evaluating interconnection service: The ERIS analysis provides the first zone-specific financial modeling to support an energy-only path in PJM. If your project economics work without capacity market revenue — particularly for solar or wind in Dominion, AEP, or ComEd zones — ERIS could offer a faster route to commercial operation with lower upgrade costs. Watch whether GD2 test results under TC2 produce a meaningful cost difference between ERIS and NRIS projects.
Transmission planners: The 201 GW queue means congestion management will drive interconnection costs for years. If ERIS resources are studied in a separate track as recommended, planning processes will need to account for curtailment-based congestion relief rather than upgrade-based solutions.
Surplus interconnection applicants: Move any in-progress Queue Point requests to NextGen before August 27. The automatic deposit calculation and electronic SISSA signing streamline the process, but the platform switch is mandatory — not optional.
RMS Energy supports clients across PJM’s interconnection process, from cycle study navigation to surplus interconnection requests and deliverability analysis. If your organization is evaluating the ERIS path or preparing for Cycle 01 Phase I studies, our T&D engineering team can help assess the trade-offs.
“With 201 GW waiting in the queue and 99% of it requesting full capacity rights, the question is no longer whether PJM’s interconnection process can handle the volume — it’s whether the industry is choosing the right interconnection product for every megawatt.”
Source: PJM Interconnection Process Subcommittee Meeting, August 24, 2026
Meeting materials: https://www.pjm.com/committees-and-groups/subcommittees/ips
#PJM #Interconnection #ERIS #NRIS #EnergyStorage #InterconnectionReform #CapacityMarket #TransmissionPlanning #RPM #GridReliability #RMSEnergy